
Description
 Taylor Trading Zone
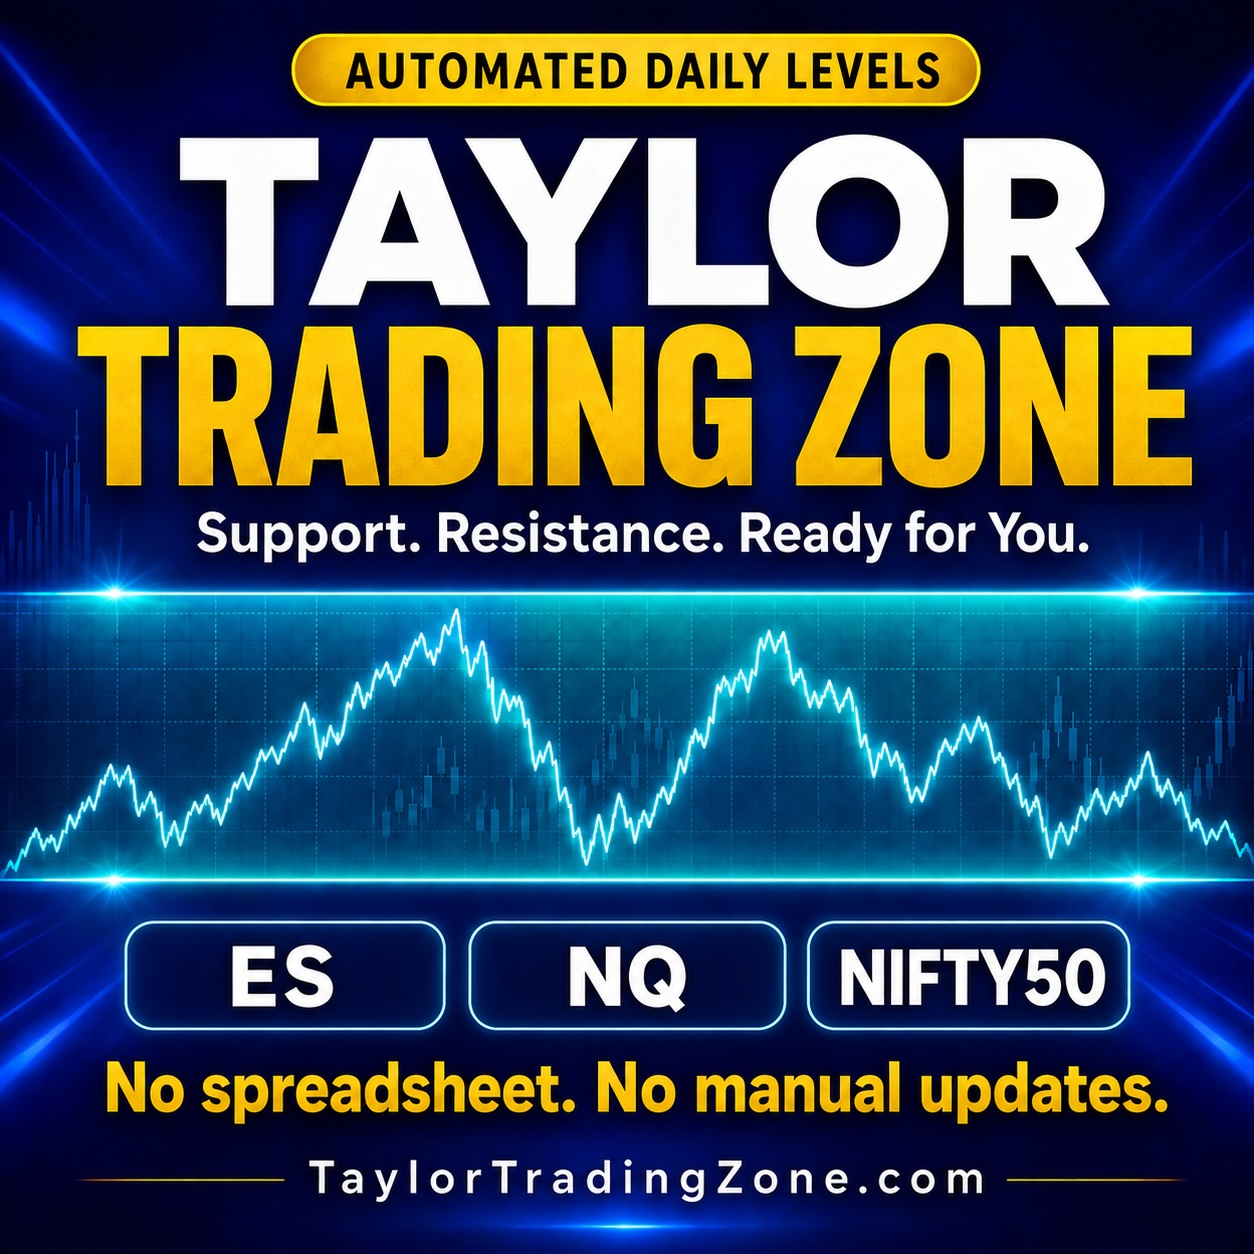
Daily trading zone for multiple markets
Know the day’s likely support, resistance, and range before the market opens. The Taylor Trading Zone is a mathematical model giving traders a significant edge by predicting where price is likely to trade. Traders worldwide say the Taylor Trading Zone has improved their trading results. Traders have a visual indication of the day’s trading range before the market even opens. Some call it the closest thing to a crystal ball for trading. The new Taylor Trading Zone is completely automated. Simply log in and place the zone on your chart to prepare for the day’s action.
Be prepared for better trading results
You get multiple markets, including ES, Nasdaq, & Nifty50.
- Taylor Resistance: The projected upper boundary of the Trading Zone.
- Taylor Support: The projected lower boundary of the Trading Zone.
- Projected Range: The calculated range for the zone.
- Pivot Points: See where support becomes resistance and resistance becomes support.
- Market data: The open, high, low, and close used in the calculation.
- Source session date: Clear identification of the market session behind the displayed results.
- Historical Data: back-test and review prior zones for each market.
Use these levels to mark the Trading Zone on your own chart and bring a consistent reference point to your preparation for the next trading session.
Automatic Updates for multiple markets including ES, Nasdaq, Nifty50.
The Taylor Trading Zone app currently provides the trading zone for multiple markets including ES, Nasdaq NQ, and Nifty50. The app uses the regular trading session of 9:30 a.m. to 4:00 p.m. Eastern Time for ES and NQ. For Nifty50, the regular trading session runs from 9:15 a.m. to 3:30 p.m. India Standard Time. These sessions normally run Monday through Friday, subject to exchange holidays and schedule changes. After each market’s regular session closes, its OHLC prices and Taylor Support and Resistance calculations update automatically. Each market follows its own session and timezone, so you can review the latest completed session’s data without collecting or entering prices yourself.
Review Previous Sessions
Calculation History makes it easy to revisit earlier Trading Zones. Select a market, find a previous session, and inspect the underlying prices alongside its calculated support, resistance, and range. Keep your daily preparation and historical review together in one browser-based tool.
A Simpler Routine Than the Original Spreadsheet
If you’re familiar with the original Taylor Calculator, the difference is straightforward:
- No Excel spreadsheet is required.
- No daily date or price entry is needed.
- Market data and Trading Zone calculations update automatically.
- You get the daily trading zone for multiple markets.
- Previous calculations are accessible through the history screen.
- Historical trading zone for back-testing and research.
Simply log in at TaylorTradingZone.com, select your market, and review your zone.
Choose From Semi-Annual or Save with Annual Subscription
Your subscription gives you access to the Taylor Trading Zone for multiple markets. Data is automatically updated daily and includes historical data for each market. Make the Taylor Trading Zone part of your daily market preparation and watch your trading success improve. Traders call the Taylor Trading Zone the closest thing to a crystal ball. Your subscription renews automatically. Cancel anytime. Immediate access after purchase. Taylor Trading Zone provides analytical reference levels, not guaranteed price boundaries or trading outcomes. Trade wisely: Trading involves risk.

Reviews
There are no reviews yet.